Businesses around the world have witnessed the unprecedented fast growth of data. On the one hand, more data means more insights, which in turn can translate into better decision-making. On the other hand, this sheer volume of data might cause ambiguity if there is a lack of resources to process it. Therefore, how we turn data into insights matters. Switching from number-crunching to value-added analysis in a compelling way, makes effortless interpretation, driving inspiration and change.
With an example of procurement data, we can see how data can be used as a resource to make business decisions. A Procurement Spend Analysis Report provides a central location to aggregate multiple data sources into one source of truth that helps a business monitor the spending and manages vendors in real-time. Creating a Spend Dashboard, aligned with the business objectives, captures the performance picture and triggers actions in time to keep things under control.
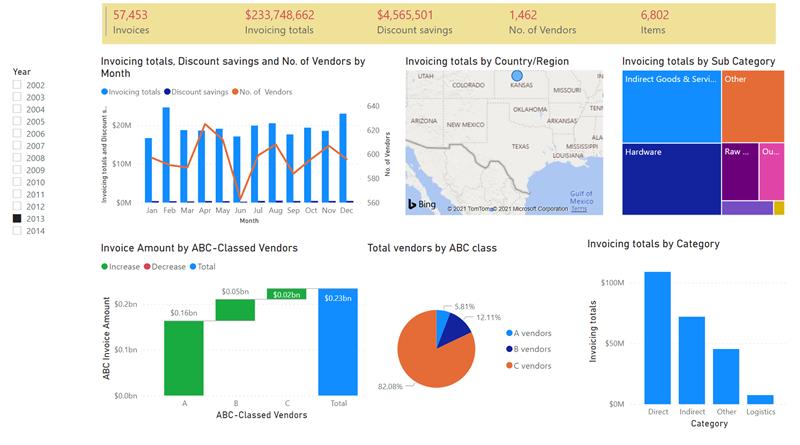
One in procurement business might wonder about these questions:
1. What is the performance of Procurement over the years (spending, no. of vendors/items, discount saving)?
2. Which business unit has spent the most?
3. In which category/sub-category/items have we spent the most?
4. What are the top vendors?
5. Which items should we prioritize?
6. What is the monthly comparison of spending over sub-categories over the years?
7. How does future spending look like?
Watch this video and it will shed light on those seven areas:
Transformation Team can help your business transform data into actionable insights with a range of services. We support businesses with data analysis (Budget/Actuals/Forecasting), data visualizations with dynamic reports and dashboards, and decision-making models powered by Machine Learning and Artificial Intelligence.
Contact: Seun Ogunleye, Head of Transformation, +47 909 78 421.